Macroeconomics sentiment trends analysis in Twitter
Introduction
Every day more than eight hundred million tweets are sent, around ten thousand every second. All those tweets are valuable data that shows what is going on all over the world at all times, providing an insight on a wide variety of topics. The transformation from data to information is one of the most important abilities nowadays if not the most, and Datapta specializes in using the data from Twitter to generate useful information about the economy and the stock market.
Datapta provides not only an insight of what is going on in real time about certain economic concepts or the stocks but also the context surrounding it in order to have a better understanding of the whole picture.
Data obtention
Our search engine focuses on two main types of data: macroeconomics (tweets 1 and 2) and a wide range of assets (tweets 3 and 4). To make it more practical in this case, there is a focus on specific groups of stocks such as the S&P 500 companies, commodities like gold or the most known cryptocurrencies like Bitcoin.
ID: 1553104928926826497
ID: 1553001112025849859
ID: 1551308361387462656
ID: 1549780366591918082
Using these four tweets as reference, we will identify the key data that is analyzed in order to generate useful results:
- Tweet 1. Body: ‘I appreciate these gains, don’t get me wrong, but we shouldn’t let our guard down just because of price action. The #economy is still deteriorating: corporates started to lower guidance and miss earnings, layoffs are spreading fast, #inflation is high. It’s still a bear market.’. Relevant metadata: economy, inflation
- Tweet 2. Body: ‘The June 1.1% rise in personal spending doesn’t reflect a strong consumer, but #inflation. Consumers bought less, but paid more. The YoY PCE deflator rose the most since 1982. The savings rate plunged to 5.1%, its lowest since Aug. 2009, when the economy was also in a #recession.’. Metadata: inflation, recession
- Tweet 3. Body: ‘My “must have” gems 💎 right now: \n\n $BTC \n$ETH \n$SOL\n$BNB\n$KASTA\n$MATIC\n$MANA\n$ADA\n$DOT\n$CATE\n$CHEEMS\n$SHINJA\n#NFTBOOKS\n________’. Relevant metadata: BTC, ETH, SOL, BNB, KASTA, MATIC, MANA, ADA, DOT, CATE, CHEEMS, SHINJA
- Tweet 4. Body: ‘NEEDHAM: “NFLX\’s y/y revenue growth rate has fallen in every quarter for the past 6 quarters.” Meanwhile, $AMZN and $AAPL are spending on sports. “Unless $NFLX proves immune to economic theory, it will be the primary source of other streaming services sub growth.”\n\nReiterate Hold’. Metadata: AMZN, APPL, NFLX
As we can see, the relevant metadata varies on the type of tweet that is being analyzed. This is because cashtags are used over hashtags when talking about stocks but hashtags are prefered when tweeting about more general topics like macroeconomy.
NLP models
Now that we have a basic understanding of what type of data is used, we will focus on the main advantage Datapta offers against its competitors: the prediction engine.
Datapta uses the latest technologies in Artificial Intelligence and Natural Language Processing to obtain relevant information from the data aforementioned. There are two main functionalities; a NER (named entity recognition) model to identify relevant entities from macroeconomic data and a Sentiment model to obtain the sentiment on both types of data. Both models, in combination with other transformations, generate the following results:
| Clean body tweet | Tweet sentiment | Relevant entities | |
|---|---|---|---|
| tweet 1 | I appreciate these gains, don’t get me wrong, but we shouldn’t let our guard down just because of price action. The economy is still deteriorating: corporates started to lower guidance and miss earnings, layoffs are spreading fast, inflation is high. It’s still a bear market. | Negative (0.5105) | gains, price action |
| tweet 2 | The June 1.1% rise in personal spending doesn’t reflect a strong consumer, but inflation. Consumers bought less, but paid more. The YoY PCE deflator rose the most since 1982. The savings rate plunged to 5.1%, its lowest since Aug. 2009, when the economy was also in a recession. | Negative (0.4578) | June, PCE, 1982, Aug. 2009 |
| tweet 3 | My must have gems right now: BTC ETH SOL BNB KASTA MATIC MANA ADA DOT CATE CHEEMS SHINJA | Positive (0.5833) | |
| tweet 4 | NEEDHAM: NFLX’s y y revenue growth rate has fallen in every quarter for the past 6 quarters. Meanwhile, AMZN and AAPL are spending on sports. Unless NFLX proves immune to economic theory, it will be the primary source of other streaming services sub growth. Reiterate Hold | Negative (0.4734) |
The data generated with the prediction engine is then processed in order to generate useful information that users and clients can use to get market insights and to generate investment ideas.
Visualization
Starting from the initial tweets we now have more relevant data, but independent or single tweets may have no relevance on a global scale. That is why we group the data generated and turn it into useful information with graphs.
The graphs we present help clients and users to have a better understanding of what the world thinks of certain topics. In order to facilitate the comprehension of the information presented, there are different types of graphs for different types of data.
Macroeconomics
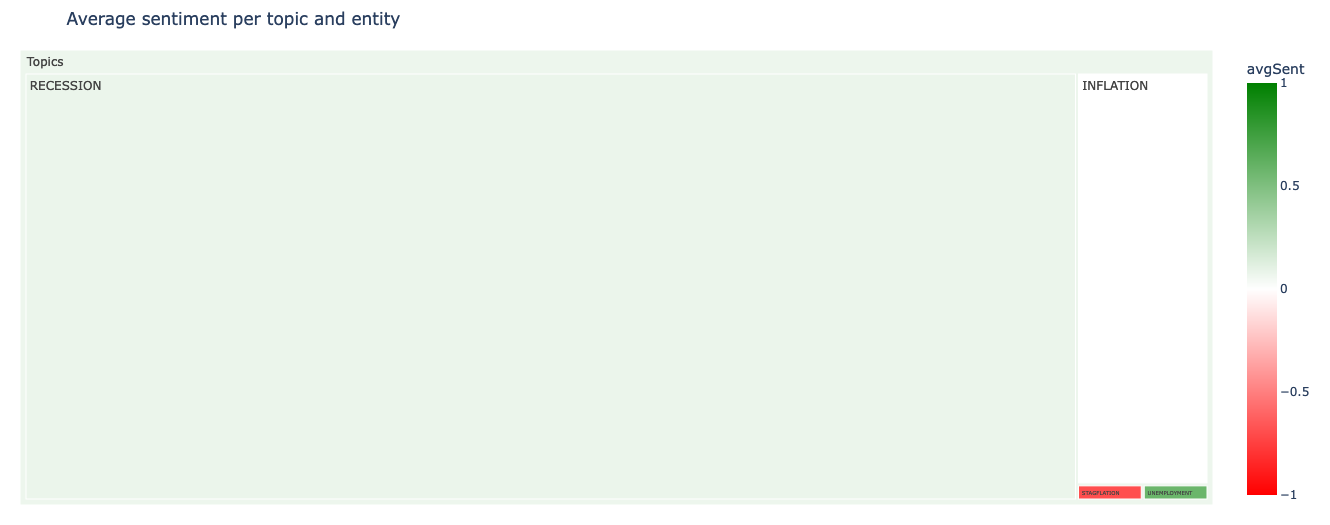
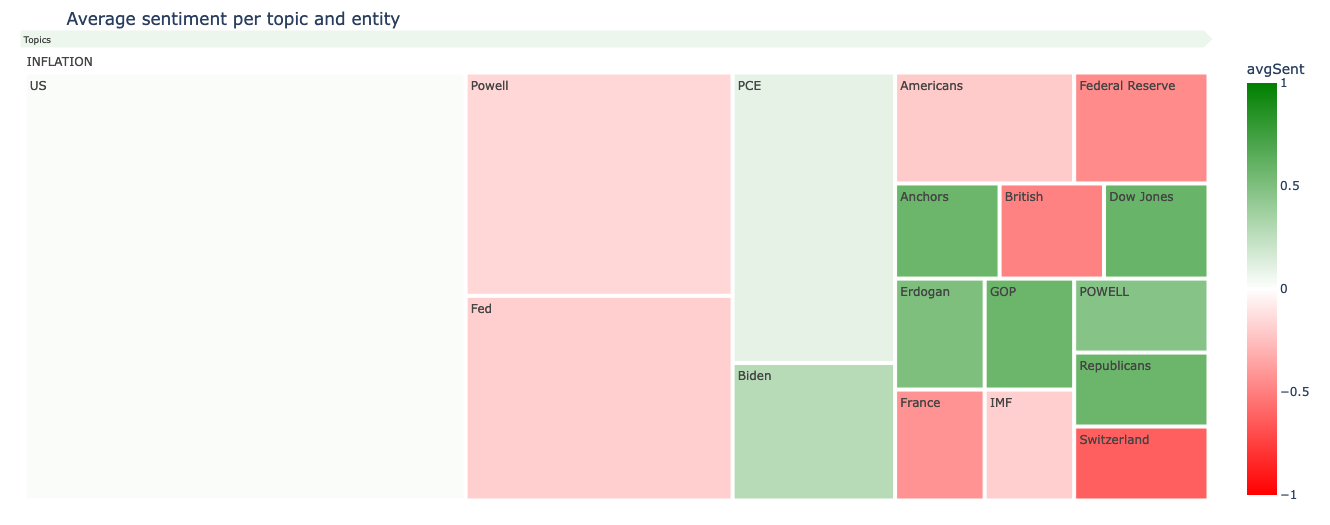
Macroeconomics information is presented in the form of a treemap with two levels, one that shows all topics and a second one with more insight on each topic showing the related entities.


The color of each box on the level 2 treemap is the average sentiment of each specific entity, whereas it represents the average sentiment of all tweets from the topic on the level 1 treemap. The size of each topic represents its relevance and the color its sentiment: a darker green color represents positive sentiment, a darker red represents negative sentiment and light colors are close to neutral sentiment.
Stocks
The stocks data on the other hand has no entities related, thus a bubble chart provides a view of a single level. Same as on the treemap, the size represents its relevance and the color its sentiment. In this case, blue is used for positive sentiment instead of green.

Twitter rates
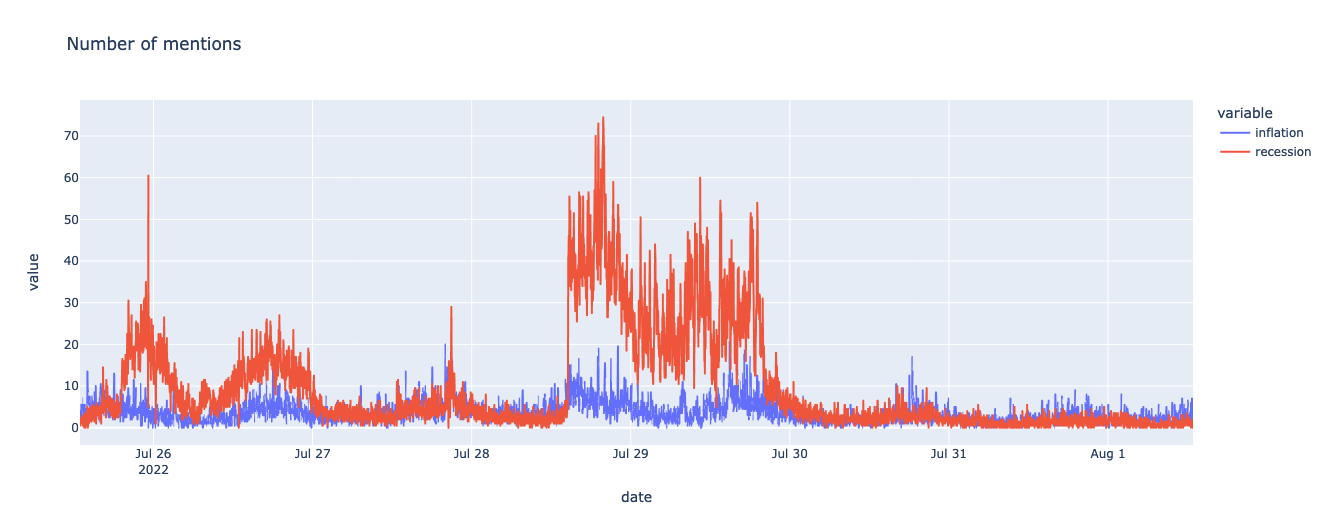
In combination with the macroeconomic and stocks graphs, we also provide a Twitter rates graph. This third type of graph helps put all the tweets in context by showing how many tweets have been read from every topic, that is, the number of mentions of every topic (macroeconomic or stock) at a certain time.

How to benefit from our graphs
Not only is it important to know how to generate relevant information but also know how to use it. The graphs we provide can help identify opportunities and trends in the stocks market and have a better understanding of the macroeconomic situation.
Following the graphs shown as examples, we can identify that on the 28th of July there was a huge increase in the number of tweets about recession that lasted more than a day while inflation had a smaller increase. Using the macroeconomic treemap and focusing on the level 2 example, the entities identified on tweets about inflation, most of the entities are related to the United States, like Biden or Fed.
This indicates that something has happened related to the United States’ economy, and if we look for news from that period of time we will be able to identify the cause: the US’ GDP fell two quarters in a row which indicates the country is in a recession but the White House argued that the common definition for recession was no longer valid.
With our graphs and the information we present, relevant news can be identified along with how people react to them. In this example, most tweets about the Federal Reserve and its president, Jerome Powell, were negative. And besides identifying macroeconomic tendencies, our visualizations can also help make decisions about investments. The bubble chart we offer in combination with Twitter rates can help identify what stocks are being mentioned and how people all over the world see them.
In this post we have exposed some of the functionalities of our opportunities engine and have made a little demonstration of how simple it can be to use our engine, for example, to summarize social networks information to validate the situation of the markets. In our next steps we plan to make available the power of our engine by building an online platform that will enable users to make queries about macroeconomy and a wide range of investment assets.
Shared This!


