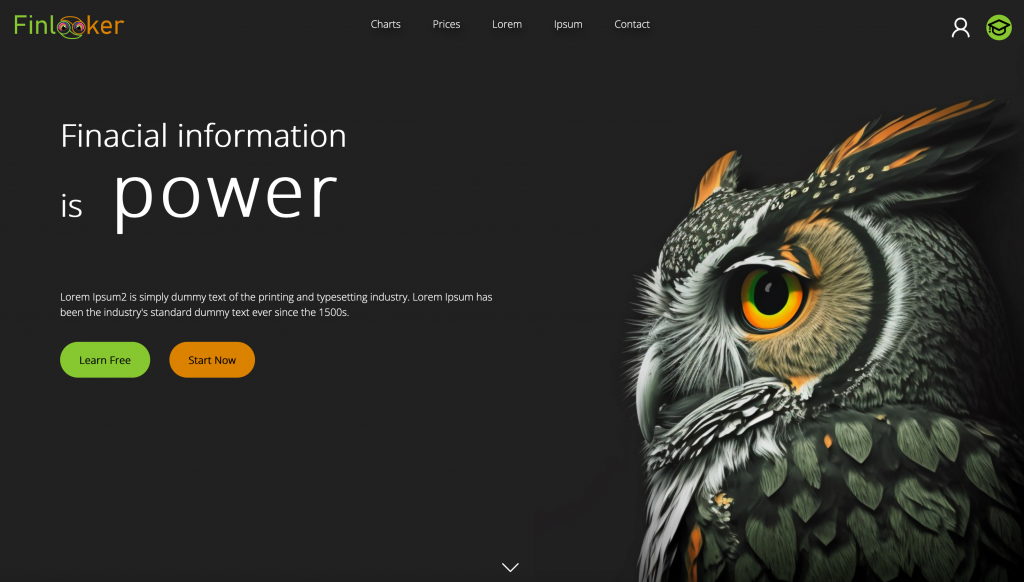
Finlooker is your personal investments quick tool that will enable you to be updated about the state of the markets and economies while spotting possible opportunities to invest across a wide range of financial assets. It provides with the information about the driving forces that move the markets and is aimed to save time to the retail investor for keeping track of the events that could affect they existing investments or being notified when some intended investments could be in a good situation to be performed.
Start with a free account to have access to markets sentiment data.
Account gives access to both mobile and web app.
Analyse the markets, economies, liquidity and assets like professional investors.
Be notified about events that can represent an opportunity to invest with small risk.


Macroeconomics: have a bird’s view of the marcoeconomics in the world to anticipate next possible crysis.
Liquidity: know the liquidity around the world to be aware of the current trend to predict possible assets inflation.
Sentiment: be updated about the popularity of different assets throught time. Detect a possible black swarm or cyclical events when this are happeing in real time.
International assets: check out the price of the main assets across international markets.
Local assets: check out your local investment opportunities such as real estate or government bonds.
While the finlooker mobile app is the perfect companion for the retail investor that surveils investments opportunities around assets, the finlooker web app is the place where the investor can check out with more time and with more detail if those opportunities are worth it with respect to their risk. In the tipical use case, the investor detects some opportunity through the mobile app, while before making any decision in their porfolio, a more thorough examination can be done through the web app.
Finlooker web app is a responsive website that loads finance charts containing valuable and pioneering fincial information. It makes much easier for an investor to have this valuable information in a single site instead of going through different sites specialized in a single topic. At the same time, it only gives the required information to have a general picture of the markets and economy while covering most of driver factors for investments.
Enjoy form an already created schema to check the state of the markets in a quick way.
Advanced graphics allow to see multiple time series in the same chart to establish possible correlations in between indicators and assets.
Synchronize your chart configurations across the web app and mobile app.
Share screenshots of your chart findings in popular social networks.


